
How to Measure Machine Shop Marketing ROI: From RFQ to Won Work
Summary
Measure marketing by tracking suitable inquiries through quotes, orders and delivered contribution. Use consistent source and cost definitions, keep open quotes separate, and review one improvement each month.
By Matthew Borza, KriXis · Published October 9, 2026 · About 13 minutes to read
More website traffic can look encouraging while the estimating team sees little useful change. Perhaps inquiries increased, but most need a process you do not offer. Perhaps good RFQs arrived, but nobody recorded where they came from. Perhaps quotes are still open when the monthly report declares the campaign unsuccessful.
Measuring machine shop marketing ROI starts by connecting discovery, qualification, quoting, and commercial outcomes. The aim is a defensible answer to two questions: which activities bring work worth pursuing, and where does that work stop progressing?
This guide gives owners and sales teams a practical measurement system, a worked example, and a monthly review process. The examples are fictional planning illustrations. They are not KriXis client results or machining industry benchmarks.

Start with the work your shop wants to win
Define the business goal before selecting dashboard metrics. A shop with open capacity may need new production accounts. A fully booked operation may prefer repeatable work, a healthier customer mix, or fewer unsuitable requests. Those goals lead to different definitions of success.
Write a short description of a suitable opportunity: processes, materials, part sizes, quantities, quality requirements, commercial conditions, and timing. Ask estimating and operations to review it. The description must reflect current capability and capacity rather than an idealized service list.
Our machine shop lead qualification guide provides a scorecard for this decision. Use the same acceptance criteria when reviewing sources. Otherwise, one channel can appear stronger simply because its inquiries received a more generous assessment.
Also decide what counts as a new opportunity. One buyer may send three revisions of the same RFQ. Count that as one opportunity with a revision history, not three new leads. Keep customer accounts, projects, quote revisions, and purchase orders distinguishable.
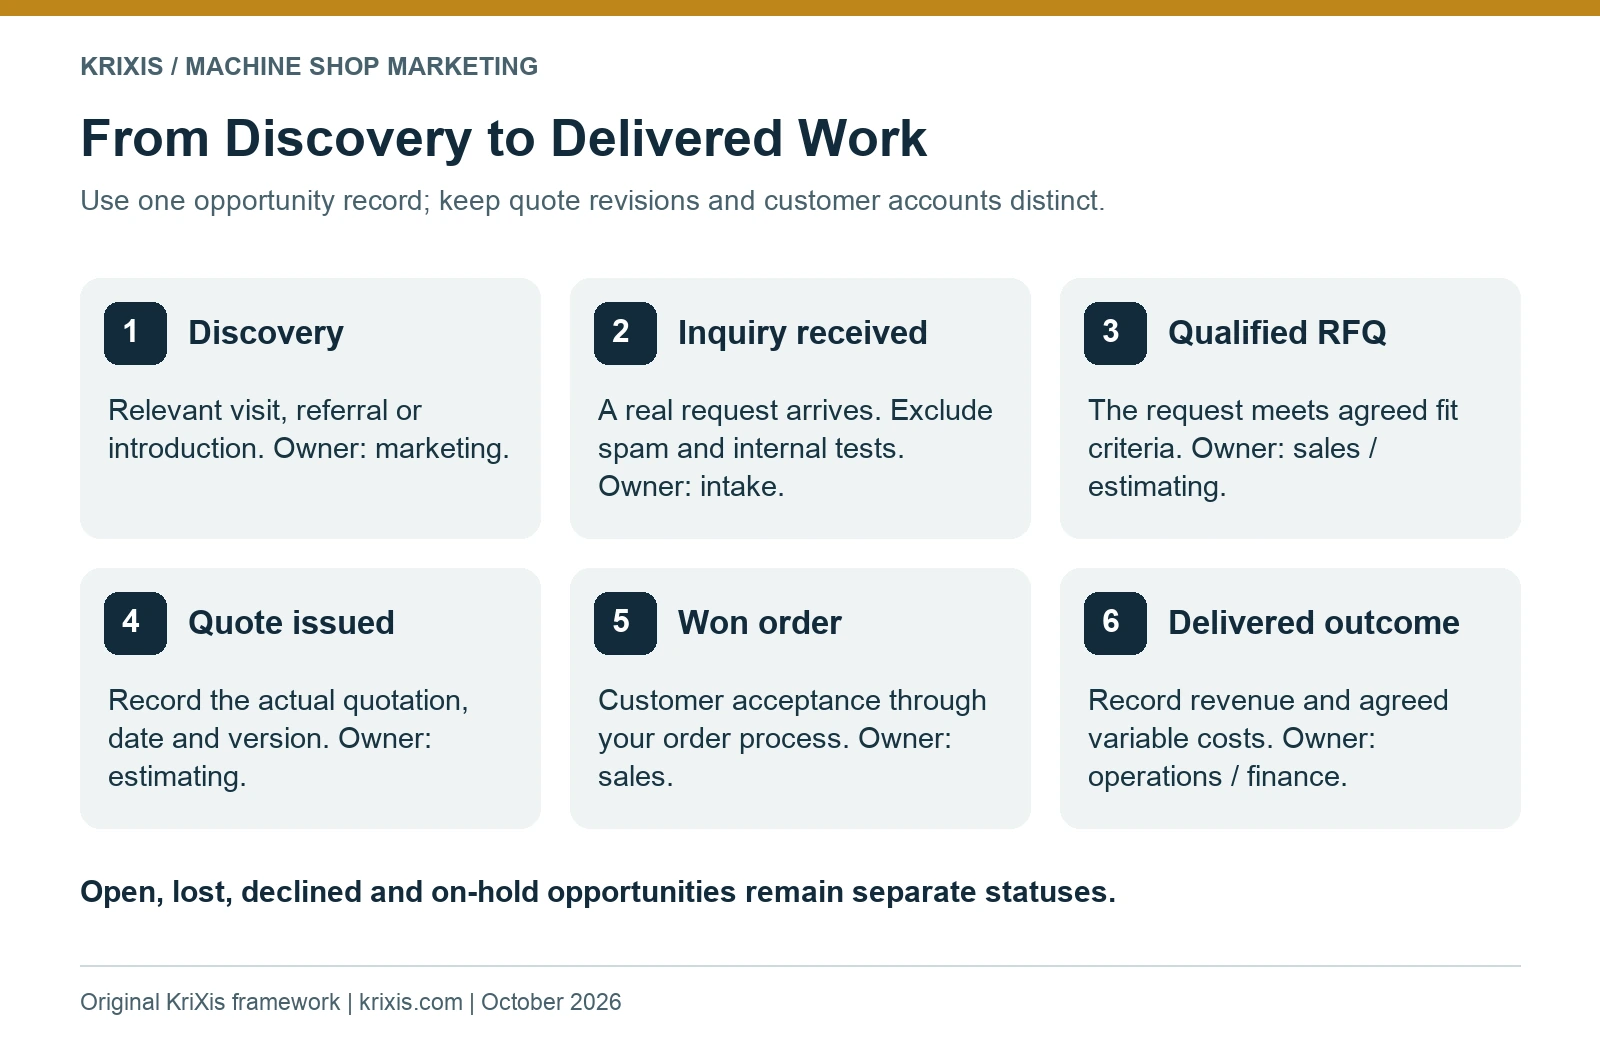
Track six stages from discovery to delivered work
Use a small set of stages that everyone can explain. Website activity provides context; the opportunity record supplies the operational history.
- Discovery: a relevant visit, referral, event interaction, or other introduction.
- Inquiry received: a real request reached the team, excluding spam and internal tests.
- Qualified RFQ: the request meets the agreed criteria for estimating review.
- Quote issued: an actual quotation was sent, with its version and date recorded.
- Won order: the customer accepted the offer through your normal order process.
- Delivered outcome: revenue and the agreed cost or contribution measure are available.
Missing information is a status that needs an owner and a next action. It is not automatically a rejection. Keep declined, lost, canceled, and on-hold work distinct, and record “unknown” when the reason is unknown.
A quoted amount is potential work, while a won order is a commercial commitment. Neither is identical to recognized revenue or cash collected. Choose the financial measure with the person responsible for your accounts and label it consistently in the report.
If you need a shared place to maintain these records, our machine shop CRM workflow explains ownership and stage rules. A maintained spreadsheet can also be a practical starting point for a small team.
Capture source information without slowing intake
Create one opportunity record when the inquiry arrives. At minimum, record its ID, receipt date, source, requested capability, qualification status, owner, quote date, outcome, and next action. Add financial values only when the business can support them.
Keep the first known source and later influences separate. A buyer might discover a capability article, return directly, speak to a colleague, and then submit an RFQ. The last visit alone would miss useful context. Conversely, an existing customer reading a new article does not make all subsequent account revenue newly acquired by marketing.
Ask a simple optional question such as “How did you first hear about us?” Use consistent categories and allow an unknown answer. Record the response as self-reported context, not independently proven attribution.

Use tagged links for campaigns you control, such as a newsletter or a paid advertisement. Google’s campaign URL guidance explains how source, medium, and campaign parameters support reporting. Use a naming convention the team can maintain. Never put an email address, customer name, drawing identifier, or other sensitive detail into the URL.
When a source is missing, preserve the gap. Guessing “organic search” because a buyer found the website creates misleading precision. Review unknown records monthly and correct the collection process where possible.
Use website analytics for successful actions
A button click, a form start, and a successfully received inquiry are different events. Measure each only if it answers a useful question. Validate the submission path by checking the confirmation and the intended inbox or CRM record with clearly marked test data.
Google Analytics recommends lead lifecycle events including generate_lead, qualify_lead, and close_convert_lead. Its recommended events documentation provides the current definitions. Later stages require an appropriate connection to your sales process; they do not appear simply because tracking code is installed.
Choose website key events carefully. A resource download can indicate interest, but it should remain separate from a qualified RFQ. A reporting setup that combines downloads, telephone clicks, and received RFQs into one “lead” number can obscure performance.
Keep ordinary analytics events free of names, email addresses, phone numbers, form-message text, and technical drawings. Google’s guidance on avoiding personally identifiable information applies to the information you send. Store project details in approved business systems and review the actual implementation before enabling integrations.
Calculate a compact set of useful metrics
Begin with six measures. Define the date range, denominator, and source rules beside them so future reports are comparable.
Qualification rate = qualified RFQs ÷ valid inquiries × 100. This indicates how well incoming demand matches the agreed criteria. Review it alongside the number of accepted opportunities. A perfect percentage based on one inquiry tells a limited story.
Quote rate = quoted opportunities ÷ qualified RFQs × 100. Use a sufficiently mature group of opportunities. Low quote rate may reflect missing information, estimating capacity, technical review, or a deliberate decision to decline.
Quote win rate = won opportunities ÷ decided quoted opportunities × 100. In this definition, decided means won or lost. Report open and canceled quotes separately. An alternative definition can use all quotes, but the report must explain it and avoid comparing the two approaches as though they were identical.
Cost per qualified RFQ = allocated marketing cost ÷ qualified RFQs. Include the costs covered by the decision: agency fees, advertising, relevant tools, and agreed internal marketing effort. Document how shared costs are allocated. This measure does not capture all estimating effort or prove the opportunity is profitable.
Cost per acquired customer = allocated acquisition cost ÷ new customers acquired. Count customer accounts rather than orders. Define the period and allocation policy, especially when a campaign creates opportunities that convert months later.
Observed contribution ROI = (attributed contribution − marketing cost) ÷ marketing cost × 100. Define contribution as revenue less the agreed variable costs for the work. If incremental contribution cannot be established, describe this as an attribution-based estimate, not proof of causal lift or accounting profit.
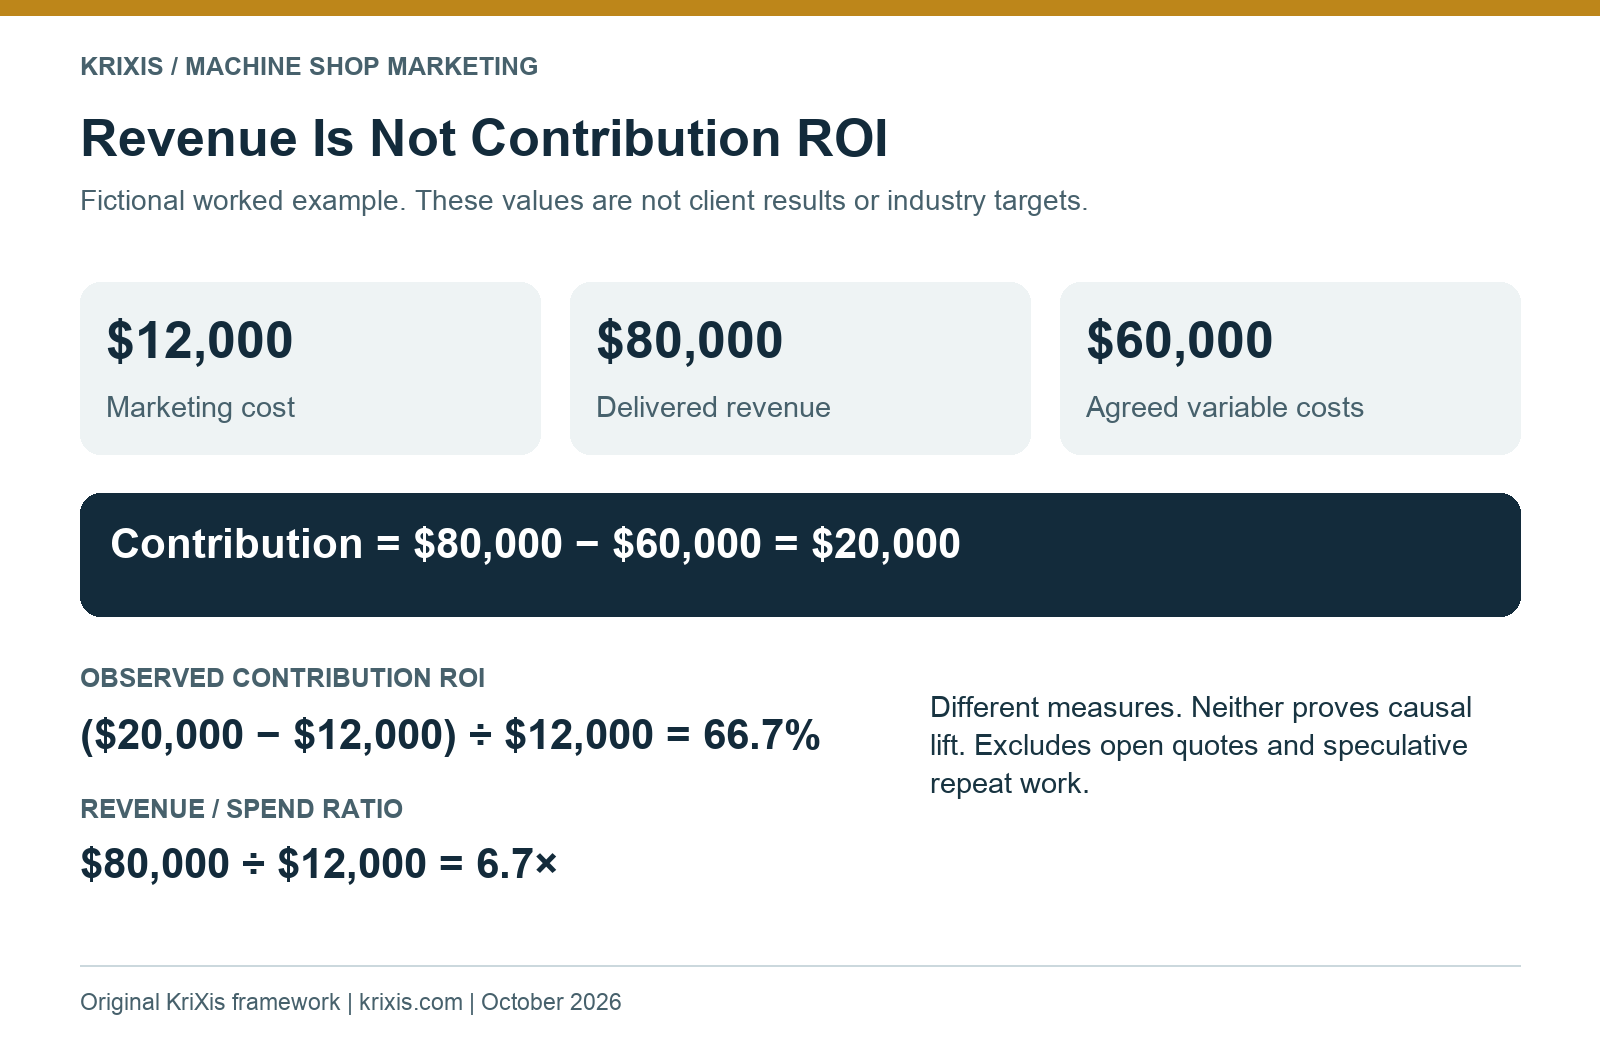
A revenue-to-spend ratio can supplement these measures: attributed revenue divided by marketing cost. Label it as a ratio. It is not the same calculation as contribution ROI because it does not subtract production costs.
Work through a fictional machine shop example
Suppose a shop spends $12,000 on a defined acquisition program and tracks the resulting opportunity group. It receives 30 valid inquiries, accepts 18 for estimating, and issues 12 quotes. Eight quotes have decisions: four wins and four losses. Four quotes remain open.
The qualification rate is 18 ÷ 30, or 60%. The quote rate is 12 ÷ 18, approximately 66.7%. The decided-quote win rate is four ÷ eight, or 50%. Cost per qualified RFQ is $12,000 ÷ 18, approximately $667. None of those figures is a recommended target.
Assume the four won opportunities represent four new customer accounts. Acquisition cost per customer is $3,000 under the stated allocation. If two orders instead belonged to the same new account, the denominator would change. Record the actual account structure rather than using the order count automatically.
Now assume delivered work associated with those wins produces $80,000 in recognized revenue and $60,000 in the agreed variable costs. Contribution is $20,000. Observed contribution ROI is ($20,000 − $12,000) ÷ $12,000, approximately 66.7%. Revenue divided by spend is approximately 6.7 times. Presenting the latter as “670% ROI” would blur two different measures.
This example leaves open quotes unresolved and excludes speculative repeat orders. It also depends on the attribution and cost assumptions. A different production mix, delayed delivery, or inaccurate source data could change the result substantially.
Match reporting periods to the sales cycle
Use two complementary views. A calendar view shows work occurring this month: spending, received inquiries, quotes issued, orders won, and delivered contribution. A cohort view follows opportunities first received in a specified period as they mature.
Without the cohort view, January spending can be compared with January orders from last year’s relationships. That can make a good acquisition program appear weak or give it credit for work it did not originate.
Choose a review interval from your actual opportunity history. Track days from inquiry to qualification, qualification to quote, and quote to decision. Separate materially different work types when they have different buying cycles. There is no universal manufacturing waiting period that makes a campaign ready for a final verdict.
Show open pipeline separately from completed outcomes. A probability-weighted pipeline can support planning when its assumptions are grounded in your records, but it remains an estimate. Do not add pipeline value to realized revenue to create a larger return figure.
Use attribution to inform decisions, with its limits visible
Start with a simple written attribution policy. For example, assign new opportunities to their first known discovery source, record supporting influences, and mark uncertainty. Apply the same policy across channels before comparing them.
Buyers may cross devices, decline tracking, use private browsing, or contact you by phone. These gaps make perfect attribution unlikely. Keep self-reported answers, campaign evidence, and CRM history available without claiming that each proves causation.
A higher observed return does not establish that marketing caused every order. Existing relationships, customer demand, pricing, available capacity, and production performance also matter. If the business needs stronger evidence of incremental effect, design a comparison appropriate to the available data rather than inventing a counterfactual after the results arrive.
For ordinary monthly decisions, imperfect but consistently defined evidence can still help. Document which source categories need better collection and which conclusions are preliminary.
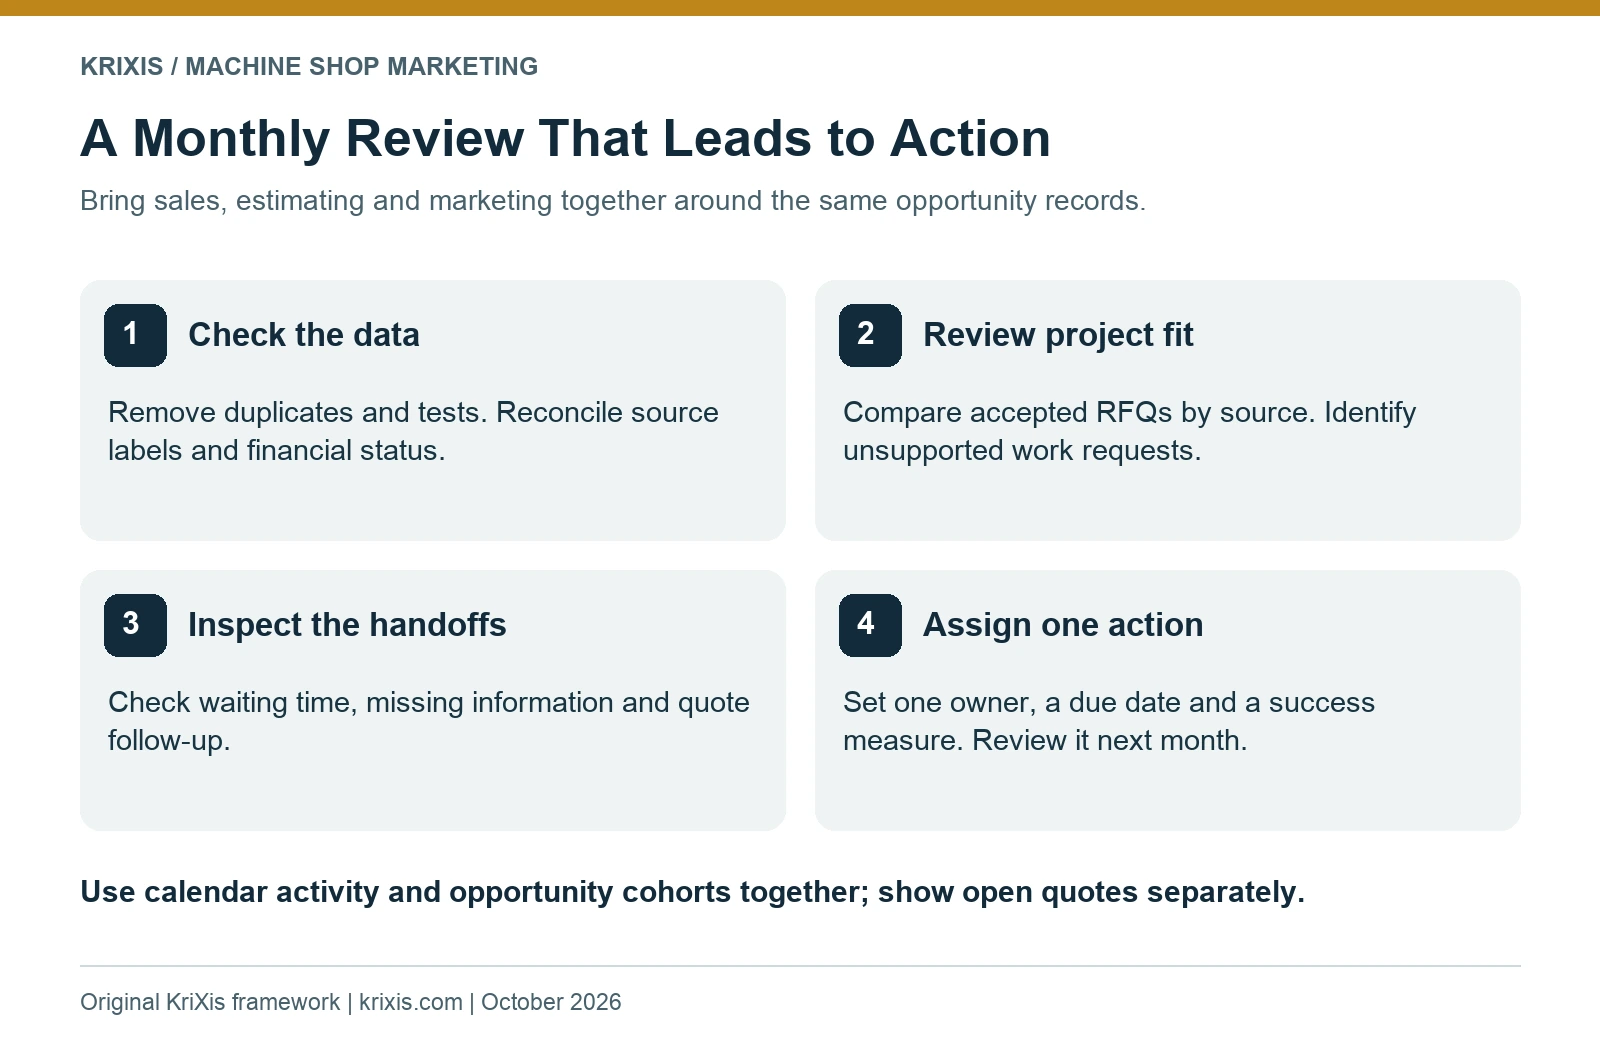
Run a monthly review with sales and estimating
Set a short meeting with the owner, marketing lead, sales contact, and estimating representative. Send the scorecard beforehand. Bring a small set of opportunity records that illustrate the main issue, using approved access controls.

First, check the data. Confirm that tests and spam are excluded, revisions are not duplicated, source labels are consistent, and won work has the right financial status. If the data is incomplete, assign a correction before making a strong performance claim.
Second, examine fit. Which channels create suitable projects? Which create repeated requests for unsupported materials, sizes, quantities, or documentation? Ask whether capability pages or campaign targeting accurately describe the operation.
Third, inspect the handoffs. How long do accepted RFQs wait? Are missing-information requests assigned? Are quotes followed up according to the buyer’s decision timing? A marketing report should make these delays visible so the responsible team can resolve them.
Finally, choose one action, an owner, a due date, and a measure of success. Examples include clarifying a capability limit, repairing form delivery, recording loss reasons, or standardizing the handoff to estimating. Review the action at the next meeting.
Diagnose the bottleneck before increasing spend
If relevant visits rise but valid inquiries do not, review capability clarity and the inquiry path. Our machine shop website design service focuses on helping buyers evaluate fit and take the next step.
If inquiries increase but qualification falls, review targeting and the work your content implies you accept. If qualified RFQs wait without quotes, investigate capacity and missing information. If suitable quotes repeatedly lose, review the buyer’s feedback, timing, commercial terms, and technical requirements.

If won orders do not produce healthy contribution, inspect the job economics with operations and finance. More demand cannot resolve an unfavorable production mix by itself. The response may involve refining preferred work or reviewing assumptions before scaling acquisition.
KriXis’s machine shop lead generation services connect discovery, website conversion, and follow-up. The measurement review helps identify which part of that process needs attention first.
Build a reliable baseline in the next 30 days
In week one, agree on opportunity definitions, fit criteria, source categories, and the financial basis. In week two, test the inquiry path and start recording new opportunities consistently. In week three, reconcile a recent sample with sales and estimating. In week four, produce the first scorecard and assign one improvement.
Treat that first month as a baseline-building exercise. It can reveal broken delivery, incomplete records, or poor fit quickly. It may not provide enough decided or delivered work to support a meaningful ROI conclusion.
Continue following the original cohort as it matures. Preserve unknown values and document revisions to the calculation. A useful measurement system becomes more informative as the team maintains it.
Common questions about machine shop marketing ROI
Should we measure RFQs or revenue?
Measure both at their appropriate stages. Qualified RFQs help evaluate current demand and fit, while delivered revenue and contribution help assess completed outcomes. Show the relationship and timing rather than combining them into one score.
What is a good cost per qualified RFQ?
There is no universal target. It depends on project economics, quote success, customer value, estimating effort, and your capacity. Use your own history and clearly stated assumptions to decide what is acceptable.
Can we start without a CRM?
Yes. A consistently maintained record with defined stages and an assigned owner can establish a baseline. Move to a CRM when collaboration, volume, reminders, or reporting needs justify it.
Does downloading the worksheet count as a qualified lead?
No. A download indicates resource interest. A qualified RFQ requires the agreed project and fit criteria to be reviewed. Keep those actions separate in reporting.


Trackbacks & Pingbacks
[…] views or downloads do not demonstrate won work. Our marketing ROI guide connects inquiries with later commercial stages while keeping attribution limits […]
Leave a Reply
Want to join the discussion?Feel free to contribute!